
» A Ruby library to plot charts in PDF files «

Either type gem install squid or add gem 'squid', '~> 1.2' to your Gemfile.
Note that Ruby >= 2.1 is required. And Rails >= 4.0, if used with Rails.
The project is open source (MIT license) and the code available on GitHub.

Squid adds a single method chart(data = {}, settings = {}) to the Prawn::Document class.
If you have never used Prawn to generate PDF files, you should first read its manual.
Generating a PDF file with a chart is as easy as running the following Ruby code:
require 'squid'
Prawn::Document.generate 'web traffic.pdf' do
  chart views: {2013 => 182, 2014 => 46, 2015 => 134}
end
Provide the data to plot as a Hash of Hashes, one key/value pair per series.
For instance, you can plot views and uniques of a web site with:
{'Views' => {2013 => 182, 2014 => 46, 2015 => 134},
 'Uniques' => {2013 => 98, 2014 => 32, 2015 => 61}}
The names of the series (Views and Uniques) will be displayed in the legend.
The names of the categories (2013, 2014 and 2015) will be displayed on the baseline.

Provide the settings for the graph as a Hash. The valid keys are listed below.
The images illustrate the effect of applying each setting to the sample data above.

chart data # no settings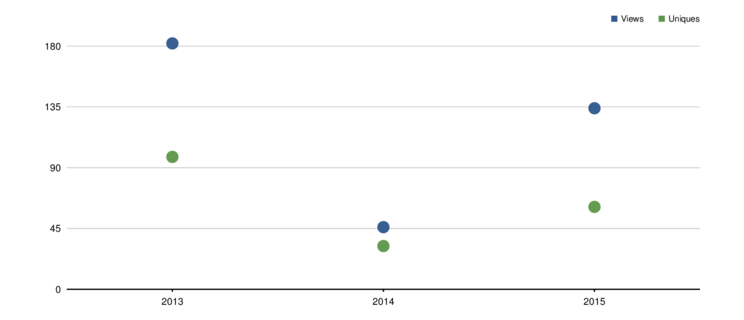
chart data, type: :point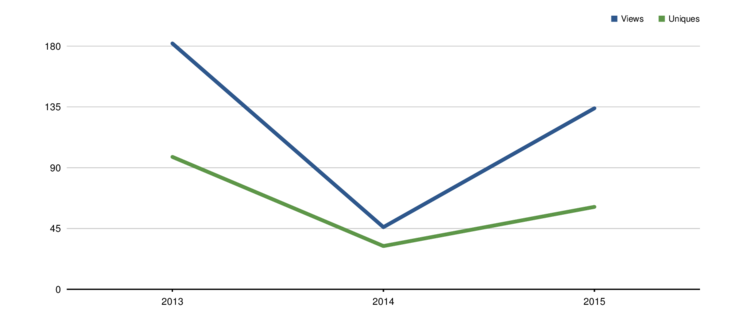
chart data, type: :line
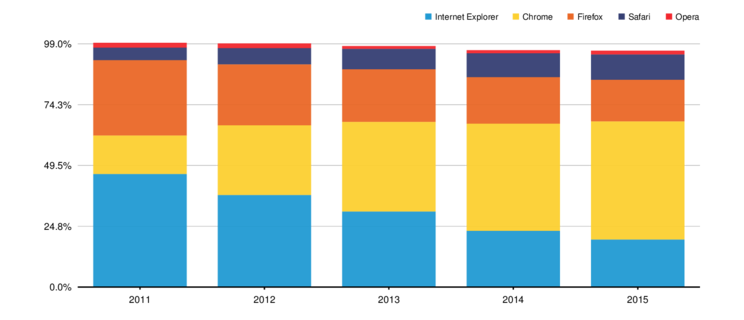
chart data, type: :stack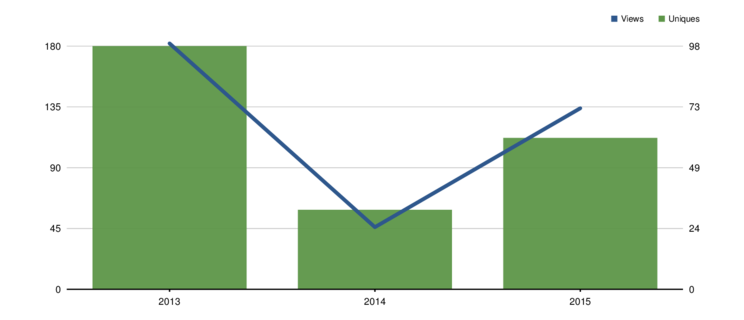
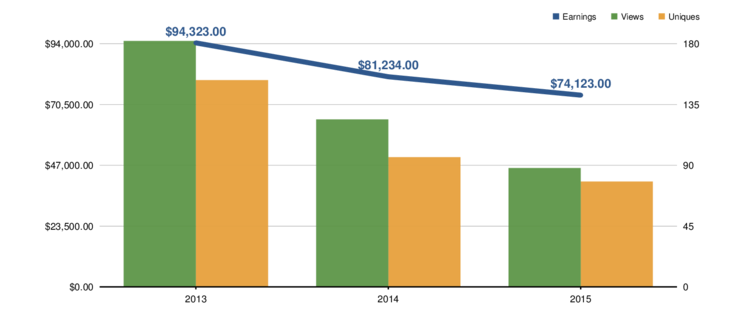
chart data, type: :two_axis![chart data, type: :line, line_widths: [2, 6]](/squid/screenshots/06.png)
chart data, type: :line, line_widths: [2, 6]
chart data, colors: %w(e7a13d bc2d30)
chart data, steps: 8
chart data, ticks: false
chart data, baseline: false
chart data, every: 2
chart data, legend: false
chart data, legend: {right: 50, bottom: 50}
chart data, border: true
chart data, height: 150![chart data, labels: [false, true]](/squid/screenshots/16.png)
chart data, labels: [false, true]
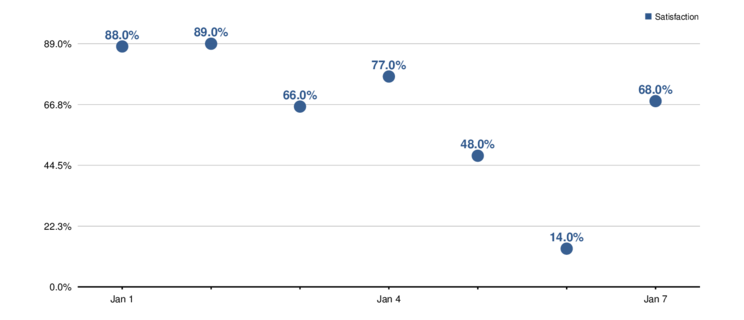
chart data, format: :percentage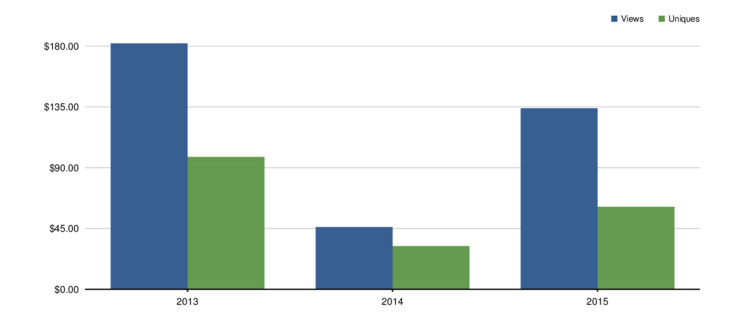
chart data, format: :currency
chart data, format: :float
chart data, format: :seconds
# multiple settings at once
Thanks to Fullscreen for letting me work on open source projects.
Thanks to Gregory Brown for creating the wonderful Prawn.
Thanks to Ruby Together for maintaining RubyGems.
Thanks to Red Robin for designing the logo.
Thanks to those who tweet about Squid.
And to those who contribute.